Compact Regions: Success, Failure, and Questions
by @eborden on March 06, 2018
At Front Row, we’ve been following the development of Compact Regions with much anticipation. Our API servers contain a cache of static data that is a perfect use case for this GHC feature. In pursuing its use we’ve encountered many successes, failures, interesting diversions, and, in the end, open questions.
Our First Attempt
Compact Regions landed in GHC 8.2.1. We were very excited to put them to use. Our
static cache consumes about 500MB of space, which means the garbage collector
is constantly traversing this data on major GC cycles. Using Data.Compact we
could remove the cache from GC cycles, which could reduce our latency, CPU usage,
and leave the GC to what it is good at - throughput.
We use Yesod. Every API server contains an App type that can be accessed by
request handlers. The cache is within this App, simplified here:
data App
  = App
  { appSettings :: AppSettings
  , appCache :: Cache
  }
On our first pass we simply wrapped the type in Compact and redefined our
property as a function to unwrap it.
--   , appCache :: Cache
++   , appCompactCache :: Compact Cache
     }
++
++ appCache :: App -> Cache
++ appCache = getCompact . appCompactCache
This was easy enough. On App initialization we call compact and all the hard
work is done.
initApp :: IO App
initApp = do
  appSettings <- loadAppSettings

  appCompactCache <- compact =<< loadCacheData
  putStrLn "Cache compacted"

  pure App
    { appSettings
    , appCompactCache
    }
Great! We’ve compacted our data.
Our First Failure
All of this type checks. We are in the clear, time to run our server and win at life.
$ stack exec api

*** Exception: compaction failed: cannot compact functions
Great, what did we do wrong? Where did we accidentally include functions?
Sneaky Dictionaries
It took a fair amount of digging to figure out what was happening here. Cache
was mostly populated by types like HashMap MathQuestionId (Entity MathQuestion). From a
naive perspective these types do not include functions. On a closer look we
learned otherwise.
The Entity type was hiding a secret: a typeclass dictionary.
data Entity record = PersistEntity record => Entity
  { entityKey :: Key record
  , entityVal :: record
  }
That PersistEntity constraint meant the Entity type carries a pointer to a
function*. This was the source of compaction failure. Was it impossible to
compact functions or was it just not implemented?
Our First Success
After reading more about Compact and consulting E.Z. Yang,
we learned that compacting functions was not impossible, just hard. How hard
was it? One of our engineers took a dive into GHC internals to find out.
The core functionality of compaction is implemented in Compact.cmm.
After instrumenting this code we learned that our typeclass dictionaries were
implemented as static functions, FUN_STATIC. This was good news. Regular
functions are hard to compact because they can include free variables that are
volatile. A static function is stable and its free variables must also be
static. This reduces the complexity. A bit of hacking later and we had a version
of GHC that could compact static functions.
After rebuilding our application with our forked GHC we spun it up:
$ stack exec api

Cache compacted
Success!
Our Second Failure
Everything was looking up. We had a path forward, even though it required some invasive changes in GHC. But then we ran our test suite.
*** Exception: compaction failed: cannot compact functions
What!? We just fixed that.
Optimizations
We run our server build with -O2. We run our test suite with -O0, for
development speed. After viewing output from our instrumentation we learned GHC
only allocates typeclass dictionaries as static when run with optimizations. We
now had a build that could fail depending on optimization level.
This was no good. In order to integrate Compact regions we either needed to
remove the Entity type from Cache or fully implement function compaction in
GHC.
Times Up
At this stage our time for this spike ran out; we had discovered a lot, but had
not proven the efficacy of this change and needed to move back to other pending
work. Our move to Compact stalled, the work went in to the icebox and was
de-prioritized.
Our Second Success
The task to move to Compact languished in the icebox for a few months until a
recent blog post
rekindled interest. This time we were going to prove the work’s value before
falling down a rabbit hole.
Profiling
We spun up a minimal server that served two purposes:
- It loaded
Cacheinto theApptype. - It served a
/pingendpoint for minimal request/response churn.
This test server allowed us to remove Entity from the Cache type and replace
it with a similar type without having to change large swaths of business
logic.
data CompactEntity a = CompactEntity
  { compactEntityKey :: Key a
  , compactEntityVal :: a
  }
We ran this server in 4 scenarios:
- Do not load
Cache. - Load
CacheintoAppas we normally do. - Load the
Cache, but don’t store it inAppand let the GC reclaim it. - Load the
Cache, compact it and store it inApp.
Startup
Running the server for 15 seconds gave us startup information. GHC’s -s RTS
option gave us relevant information:
| Config | Memory In Use | INIT | MUT | GC | EXIT | TOTAL |
|---|---|---|---|---|---|---|
| No Cache | 15MB | 0s | 0.256s | 0.872s | -0.064s | 1.064s |
| Live Cache | 374MB | 0.004s | 5.476s | 13.012s | -0.748s | 17.744s |
| GC Cache | 344MB | 0.004s | 4.244s | 4.940s | -0.012s | 9.176s |
| Compact Cache | 488MB | 0.000s | 3.984s | 5.188s | -0.008s | 9.164s |
These numbers were promising. We were seeing a 50% improvement in GC activity on
startup. Starting the server with Compact had a similar GC profile to simply
loading the data and letting it be collected. This makes sense. By adding the
data to Compact we must traverse the whole tree and copy it, just like the
GC would. That data then lives in its own region and does not participate in
subsequent collections. It is essentially collected from the perspective of the
GC. The only cost seems to be an additional 100MB in memory residence, a
reasonable space/time trade-off.
Longer Run Times
These are web servers, so they run for extended periods of time. Since we were
seeing the most activity on startup we can infer that the initial cost of
loading and compacting the Cache will amortize out across the total run of a
server and our gains will get better. We ran the same test, but for 10
minutes**:
| Config | Memory In Use | INIT | MUT | GC | EXIT | TOTAL |
|---|---|---|---|---|---|---|
| No Cache | 15MB | 0s | 5.204s | 21.116s | -0.012s | 26.316s |
| Live Cache | 374MB | 0.004s | 14.960s | 487.296s | -0.776s | 502.488s |
| Compact Cache | 488MB | 0.000s | 8.956s | 26.424s | -0.012s | 35.368s |
This looks fantastic. This is an order of magnitude reduction in GC activity on a 10 minute run. This cost would continue to shrink as the uptime of these servers continues to grow. These numbers impressed us.
In Which We Fail a Third Time
It was time to prioritize this work; we were leaving tons of performance
on the floor. An engineer got to work converting Entity inside of Cache to
CompactEntity and refactoring business logic to match. The amazing
refactor-ability of Haskell meant we were ready to test in production the same
day.
Instrumenting Production
We do not currently collect GHC runtime stats for our production API servers. This is
possible through ekg and GHC’s -t flag, but we have yet to prioritize that
work. As a result we converted our expectations to high level metrics. In the
end these high level metrics are what matter; runtime stats can enable a deeper
understanding, but reducing resource utilization and increasing overall
performance is our aim.
We expected to reduce the amount of time spent on GC cycles and observe:
- Lower CPU usage.
- Reduced request latency in the 95th percentile.
- A rise in memory use per the space/time trade-off we observed in tests.
Running The Test
We spun up two versions of our API server stack. One version compacted Cache, the
other did not. We load balanced traffic 50/50 across these versions and observed
our container metrics. What we saw was not what we expected.
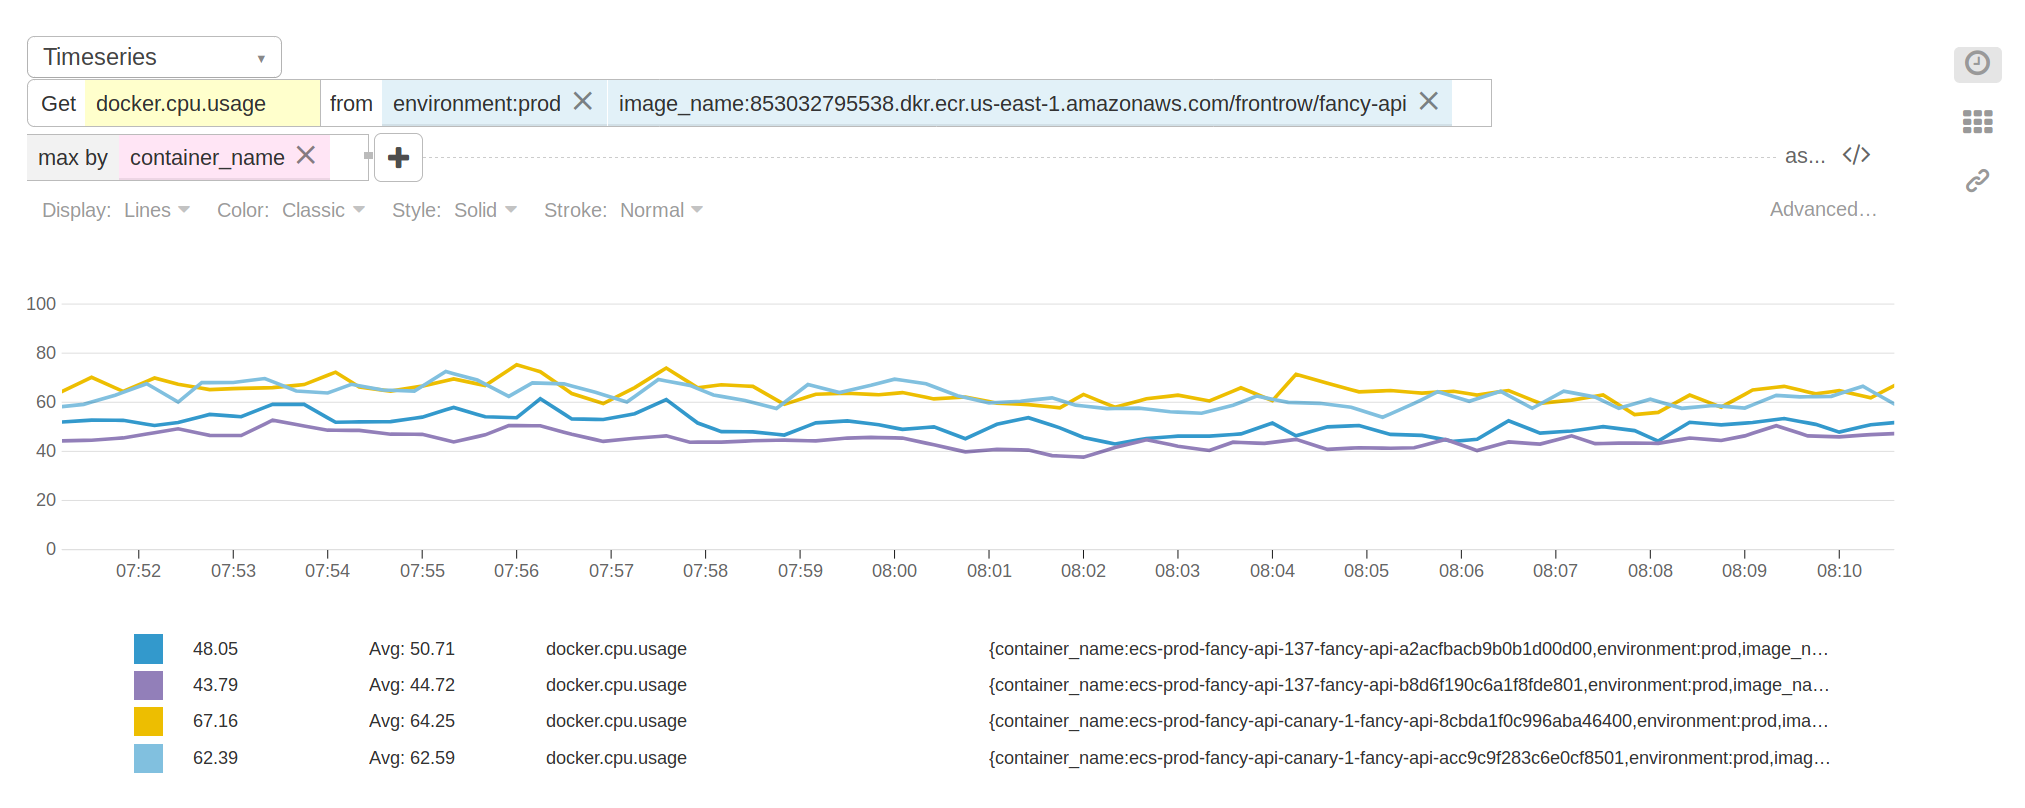
We didn’t see much difference as traffic ramped up across our servers. The
memory residence of the Compact servers was about 50MB higher - that matched
our expectations. However, as the day went on, the stats went south. The
Compact servers displayed a consistent 15-20% increase in CPU utilization
with no observable change in latency. With these results we aborted the test
and put the work back in the icebox for another day.
Gut Checking Our Assumption
After seeing this behavior we returned to our local test server. Was it also displaying this errant CPU increase? A few simple tests later and we discovered that our test server did not experience the same CPU increase. On the other hand there was no appreciable decrease in CPU utilization; both compact and live caches performed comparably. Was our assumption that CPU churn would decrease with GC churn incorrect?
Conclusion
At this juncture we’ve put a significant amount of effort in to experimenting
with Data.Compact. Its stated use cases are highly relevant to our use
patterns, and it should provide us with value. Instead our success in test never
materialized in production. We are now left with the following questions:
- What is happening in production that makes our test server so poorly representative?
- What is GHC doing in production that caused such a spike in CPU utilization?
- What benefit does
Data.Compacthave to offer if we cannot observe it?
Our results seem counter intuitive and there is more exploration to be done.
Notes
* This constraint has since been removed in the latest version of persistent.
** Full output from -s:
No Cache
     115,982,912 bytes allocated in the heap
     164,083,808 bytes copied during GC
       3,047,008 bytes maximum residency (766 sample(s))
         536,992 bytes maximum slop
              15 MB total memory in use (1 MB lost due to fragmentation)

                                     Tot time (elapsed)  Avg pause  Max pause
  Gen  0        16 colls,    16 par    0.084s   0.020s     0.0013s    0.0088s
  Gen  1       766 colls,   765 par   21.032s   4.456s     0.0058s    0.0383s

  Parallel GC work balance: 35.69% (serial 0%, perfect 100%)

  TASKS: 32 (1 bound, 30 peak workers (31 total), using -N8)

  SPARKS: 0 (0 converted, 0 overflowed, 0 dud, 0 GC'd, 0 fizzled)

  INIT    time    0.008s  (  0.003s elapsed)
  MUT     time    5.204s  (601.635s elapsed)
  GC      time   21.116s  (  4.476s elapsed)
  EXIT    time   -0.012s  ( -0.003s elapsed)
  Total   time   26.316s  (606.111s elapsed)

  Alloc rate    22,287,262 bytes per MUT second

  Productivity  19.7% of total user, 99.3% of total elapsed

gc_alloc_block_sync: 9613
whitehole_spin: 0
gen[0].sync: 39
gen[1].sync: 131833
Live Cache
   4,785,107,608 bytes allocated in the heap
 196,253,693,896 bytes copied during GC
     167,943,968 bytes maximum residency (1192 sample(s))
       8,503,104 bytes maximum slop
             374 MB total memory in use (0 MB lost due to fragmentation)

                                     Tot time (elapsed)  Avg pause  Max pause
  Gen  0      4516 colls,  4516 par    4.036s   0.867s     0.0002s    0.0557s
  Gen  1      1192 colls,  1191 par   483.260s  79.101s     0.0664s    0.1656s

  Parallel GC work balance: 64.69% (serial 0%, perfect 100%)

  TASKS: 34 (1 bound, 31 peak workers (33 total), using -N8)

  SPARKS: 0 (0 converted, 0 overflowed, 0 dud, 0 GC'd, 0 fizzled)

  INIT    time    0.004s  (  0.002s elapsed)
  MUT     time   14.960s  (526.325s elapsed)
  GC      time  487.296s  ( 79.968s elapsed)
  EXIT    time   -0.776s  ( -0.084s elapsed)
  Total   time  501.484s  (606.211s elapsed)

  Alloc rate    319,860,134 bytes per MUT second

  Productivity   2.8% of total user, 86.8% of total elapsed

gc_alloc_block_sync: 831623
whitehole_spin: 0
gen[0].sync: 84
gen[1].sync: 9733101
Compact Cache
   5,208,636,016 bytes allocated in the heap
   1,228,996,456 bytes copied during GC
     219,776,256 bytes maximum residency (844 sample(s))
       8,797,088 bytes maximum slop
             488 MB total memory in use (0 MB lost due to fragmentation)

                                     Tot time (elapsed)  Avg pause  Max pause
  Gen  0      4747 colls,  4747 par    4.940s   1.091s     0.0002s    0.0716s
  Gen  1       844 colls,   843 par   21.484s   4.825s     0.0057s    0.0297s

  Parallel GC work balance: 9.46% (serial 0%, perfect 100%)

  TASKS: 31 (1 bound, 29 peak workers (30 total), using -N8)

  SPARKS: 0 (0 converted, 0 overflowed, 0 dud, 0 GC'd, 0 fizzled)

  INIT    time    0.000s  (  0.002s elapsed)
  MUT     time    8.956s  (600.245s elapsed)
  GC      time   26.424s  (  5.916s elapsed)
  EXIT    time   -0.012s  (  0.048s elapsed)
  Total   time   35.368s  (606.211s elapsed)

  Alloc rate    581,580,618 bytes per MUT second

  Productivity  25.3% of total user, 99.0% of total elapsed

gc_alloc_block_sync: 66225
whitehole_spin: 0
gen[0].sync: 105
gen[1].sync: 151895