A tale of two Monads: Free vs MTL
by @eborden on September 28, 2017
Much has been said about the benefits of Free monads. The idea of expressing
computation as a data type is very powerful. Separating interpretation from
representation gives us a lot of freedom, but what are its costs?
A recent blog post did a fantastic job of summarizing many of the issues with
Free, Free Monads Considered Harmful.
I don’t want to rehash those details. Instead I want to speak concretely. Why
did Front Row build a tool with Free? Why did we subsequently refactor to
mtl and how did we make that decision?
Consider your use case
Free is a powerful abstraction, but you really must consider your use case
before using it. Like the sage says, “use the right tool for the right job.” At
Front Row we utilized Free to design a library for generating arbitrary
fixtures, which makes it easy to write
integration tests. Free worked perfectly! Until it didn’t.
Why did it work?
Prototyping
Free allowed us to quickly iterate on an implementation without thinking about
transformer stacks, associativity of monads in the stack, how best to decompose
our type classes, etc. These are noise when you are prototyping. You likely
don’t even understand your semantics at first, you just need to get something
built and prove your use case.
Small graphs of data
Our initial use case, building graphs of arbitrary relational data, did not
require high performance. These graphs were shallow, building fewer than 20
artifacts, so the diminishing returns of Free did not manifest.
Inspecting the graph
We thought we might need to inspect the graph to produce finalizers for unwinding idempotent graphs. We didn’t.
Why didn’t it work?
One simple answer; unintended use cases. An enterprising engineer took this tool
and said, “Hey, can I use this to build data for benchmarking?” The answer was
obviously YES! Great, our tool has found a new use case that we didn’t
anticipate, cheers everyone. What happened next lead us to refactor away from
Free.
Generating 300,000 arbitrary entities
Our enterprising engineer quickly spun up a tool for generating 300,000 database entities to test a few new API endpoints. Writing this tool took no time, but running it did. The runtime was 30 minutes! This is unacceptable. Why did it take that long?
Probing the problem
This library is essentially a DSL around Arbitrary
and database insertion, so our first stop was the database. Were any queries
being run?
postgres=# SELECT datname, query, usename FROM pg_stat_activity ORDER BY query_start DESC LIMIT 1; \watch 1
The above query allowed us to watch for insertions, and we quickly realized that
NOTHING was being done. A quick hop over to top showed that memory was
climbing. What was going on? Why was nothing happening except generating heat?
Profiling to the rescue
GHC has fantastic profiling tools. Sadly for a long time they were locked away
because of terrible work flows. stack (and yes nix) has greatly simplified
utilizing these tools. Passing the --profile flag to a stack command will
build all your libraries with profiling instrumentation and produce .prof
files.
Building a benchmark
First we built a benchmark to get some hard and consistent numbers on speed. Our
simple benchmark was generating n nodes without any dependencies. We used
criterion to accomplish this.
import Data.Functor.Identity
import Control.Monad (void, replicateM)
import Criterion.Main (defaultMain)
import GHC.Generics
import qualified Graphula.Free as Free
import Test.QuickCheck.Arbitrary

main :: IO ()
main = defaultMain
  [ bgroup "initial algebra"
    [ bench "1"  . nfIO $ replicateNodeInitial 1
    , bench "100"  . nfIO $ replicateNodeInitial 100
    , bench "1000"  . nfIO $ replicateNodeInitial 1000
    ]
  ]

data A
  = A
  { aa :: String
  , ab :: Int
  } deriving (Generic)

instance Arbitrary A where
  arbitrary = A <$> arbitrary <*> arbitrary

instance HasDependencies A

graphIdentity :: Free.Frontend NoConstraint Identity (IO r) -> IO r
graphIdentity f = case f of
  Free.Insert n next ->
    next $ Just $ Identity n
  Free.Remove _ next ->
    next

replicateNodeInitial :: Int -> IO ()
replicateNodeInitial i = void . Free.runGraphula graphIdentity . replicateM i $ node @A
We then ran this script with profiling enabled, stack bench --profile. This
produced a little noise from criterion, but we got the information we needed.
Identifying cost centers
GHC *.prof files contain lots of useful information, but we were really only
concerned with cost. Where was our program spending most of its time? Cost center
reports show a breakdown of functions with their module/source lines and
percentage of time/allocation spent in them.
COST CENTRE        MODULE                            SRC                                                    %time %alloc

>>=.\              Control.Monad.Trans.Free          src/Control/Monad/Trans/Free.hs:(229,39)-(231,44)       20.5   27.1
>>=                Control.Monad.Trans.Free          src/Control/Monad/Trans/Free.hs:(229,3)-(231,44)        18.1   16.6
fmap               Graphula.Free                     src/Graphula/Free.hs:124:1-48                           11.8   20.0
getOverhead        Criterion.Monad                   Criterion/Monad.hs:(47,1)-(56,12)                        7.1    0.0
getGCStats         Criterion.Measurement             Criterion/Measurement.hs:(46,1)-(48,16)                  4.7    0.0
>>=                Data.Vector.Fusion.Util           Data/Vector/Fusion/Util.hs:33:3-18                       3.4    3.6
transFreeT         Control.Monad.Trans.Free          src/Control/Monad/Trans/Free.hs:337:1-79                 3.1    4.0
fmap               Graphula.Free                     src/Graphula/Free.hs:118:1-58                            2.8    6.5
fmap               Control.Monad.Trans.Free          src/Control/Monad/Trans/Free.hs:(209,3)-(211,42)         2.2    2.5
fmap               Control.Monad.Trans.Free          src/Control/Monad/Trans/Free.hs:(132,3)-(133,37)         2.2    1.8
iterT              Control.Monad.Trans.Free          src/Control/Monad/Trans/Free.hs:(309,1)-(313,21)         1.5    1.3
basicUnsafeWrite   Data.Vector.Primitive.Mutable     Data/Vector/Primitive/Mutable.hs:114:3-69                1.4    0.7
fmap.f'            Control.Monad.Trans.Free          src/Control/Monad/Trans/Free.hs:(210,5)-(211,42)         1.1    1.6
rSquare.p          Statistics.Regression             Statistics/Regression.hs:109:5-66                        1.0    0.7
nodeEditWith       Graphula                          src/Graphula.hs:(385,1)-(389,10)                         1.0    1.0
innerProduct.\     Statistics.Matrix.Algorithms      Statistics/Matrix/Algorithms.hs:42:3-51                  1.0    0.7
backendArbitrary.\ Graphula.Free                     src/Graphula/Free.hs:(253,24)-(255,10)                   1.0    0.5
fmap               Data.Vector.Fusion.Stream.Monadic Data/Vector/Fusion/Stream/Monadic.hs:(125,3)-(127,20)    1.0    1.0
This report is a dead giveaway. Collapsing stats for >>=.\ and >>= show 40%
of time and 43% of allocations are spent in binding Free. Our next top
offender is fmap from our data type’s Functor instance. We are spending
half of the time in this program just glueing computation together!
Refactoring
Obviously Free was a problem. The primary use case of our library is
generating arbitrary nodes, not monadic bind. We need to be spending our
resources more wisely. So we refactored to mtl. This was mostly mechanical
since we’d already figured out the details in our prototype.
Next step was creating a benchmark to prove our time wasn’t wasted.
import Control.Monad (replicateM, void)
import Control.Monad.Catch
import Control.Monad.Trans
import Criterion.Main
import Data.Functor.Identity
import GHC.Generics
import Graphula
import Test.QuickCheck.Arbitrary

main :: IO ()
main = defaultMain
  [ bgroup "final algebra"
    [ bench "1"  . nfIO $ replicateNodeFinal 1
    , bench "100"  . nfIO $ replicateNodeFinal 100
    , bench "1000"  . nfIO $ replicateNodeFinal 1000
    ]
  ]

newtype GraphulaIdentity a = GraphulaIdentity { runGraphulaIdentity :: IO a }
  deriving (Functor, Applicative, Monad, MonadIO, MonadThrow, MonadCatch, MonadMask)

instance MonadGraphulaFrontend GraphulaIdentity where
  type NodeConstraint GraphulaIdentity = NoConstraint
  type Node GraphulaIdentity = Identity
  insert = pure . Just . Identity
  remove = const (pure ())

replicateNodeFinal :: Int -> IO ()
replicateNodeFinal i = void . runGraphulaIdentity . runGraphulaT . replicateM i $ node @A
New cost centers
Again we ran this benchmark with stack bench --profile and inspected our cost
centers.
COST CENTRE            MODULE                            SRC                                                    %time %alloc

nodeEditWith           Graphula                          src/Graphula.hs:(385,1)-(389,10)                        18.0   19.3
attemptsToInsertWith   Graphula                          src/Graphula.hs:(419,1)-(426,60)                        18.0   16.6
replicateNodeFinal     Main                              bench/Main.hs:77:1-89                                   13.0   17.6
getOverhead            Criterion.Monad                   Criterion/Monad.hs:(47,1)-(56,12)                        6.2    0.0
>>=                    Data.Vector.Fusion.Util           Data/Vector/Fusion/Util.hs:33:3-18                       6.0    8.6
getGCStats             Criterion.Measurement             Criterion/Measurement.hs:(46,1)-(48,16)                  4.1    0.0
basicUnsafeWrite       Data.Vector.Primitive.Mutable     Data/Vector/Primitive/Mutable.hs:114:3-69                2.3    1.5
attemptsToInsertWith.\ Graphula                          src/Graphula.hs:425:17-22                                2.3    3.5
newTFGen               System.Random.TF.Init             src/System/Random/TF/Init.hs:82:1-43                     2.1    8.8
logNode                Graphula                          src/Graphula.hs:139:3-21                                 2.1    0.0
rSquare.p              Statistics.Regression             Statistics/Regression.hs:109:5-66                        1.9    1.7
generate               Test.QuickCheck.Gen               Test/QuickCheck/Gen.hs:(101,1)-(103,20)                  1.8    3.5
innerProduct.\         Statistics.Matrix.Algorithms      Statistics/Matrix/Algorithms.hs:42:3-51                  1.8    1.8
qr.\.\                 Statistics.Matrix.Algorithms      Statistics/Matrix/Algorithms.hs:29:34-51                 1.5    1.4
kbnAdd                 Numeric.Sum                       Numeric/Sum.hs:(138,1)-(141,39)                          1.4    0.9
basicUnsafeIndexM      Data.Vector.Primitive             Data/Vector/Primitive.hs:215:3-75                        1.4    2.2
fmap                   Data.Vector.Fusion.Stream.Monadic Data/Vector/Fusion/Stream/Monadic.hs:(125,3)-(127,20)    1.3    2.4
newQCGen               Test.QuickCheck.Random            Test/QuickCheck/Random.hs:80:1-31                        1.1    0.0
basicUnsafeIndexM      Data.Vector.Unboxed.Base          Data/Vector/Unboxed/Base.hs:283:841-899                  1.1    0.0
generateNode           Graphula                          src/Graphula.hs:138:3-44                                 1.0    0.0
transpose              Statistics.Matrix                 Statistics/Matrix.hs:(268,1)-(270,22)                    0.8    1.4
unsafeIndex            Statistics.Matrix                 Statistics/Matrix.hs:242:1-40                            0.7    1.0
basicUnsafeSlice       Data.Vector.Primitive.Mutable     Data/Vector/Primitive/Mutable.hs:(84,3)-(85,25)          0.6    1.3
Now these look a lot better! Our most expensive functions are all associated with generating nodes. Our costs are aligned. We are spending time and allocation where our primary use case lies.
What about timing?
Turns out this implementation was belligerently faster.
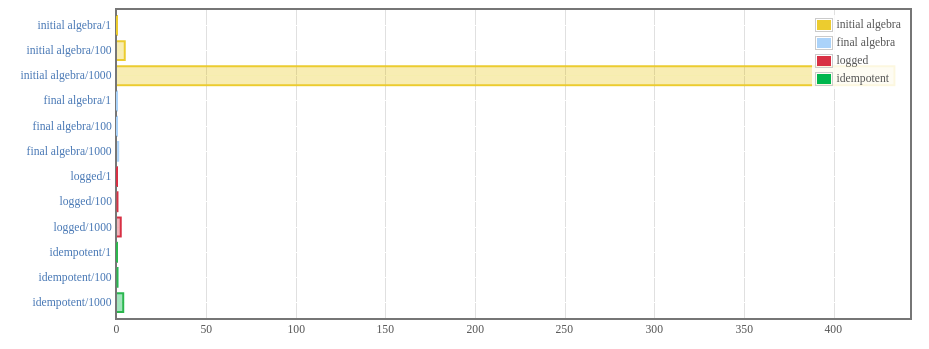
The fun part is that we barely changed anything. Some constraints needed to be
changed on our functions, but their implementations didn’t need to change
because Free allowed us to think about the core semantic abstractions first. If you
are curious you can see both implementations on github,
free
vs mtl.
The actual benchmarks live here.
Even better the runtime of our enterprising engineer’s data generation went from 30 minutes to 3 minutes. An order of magnitude is always a nice performance validation.
What did we learn?
What we learned is utilizing Free vs mtl is not universally good or
bad. They are each fantastic abstractions and it really comes down to your use
case. If your use case is going to end up building deeply nested graphs of
Free data types then it probably isn’t for you. In the end we gained a lot
clarity from prototyping with Free and a lot of performance from refactoring
to mtl.