Engineering Excellence (part 1)
by @eborden on October 03, 2022
In pursuit of excellence we must define excellence. These metrics can help keep your org honest about its delivery of excellence. As with all measures, these are the beginning of the story. Everything must live in its proper context. These measures should prompt us to dig deeper and find the source of any regressions or failures to meet our own measures of excellence.
In this first post, we will discuss industry standard metrics and their context. In the next post, we’ll discuss internal metrics.
Metrics
What are the measures that we should strive to achieve? How do we calculate these at Freckle? What is our current understanding of them?
Deployment Frequency (per day)
deployment frequency = number of deploys in quarter / business days in quarter
Deploying often allows an organization to receive feedback quicker. Our ultimate goal in developing products is to deliver value to our clients. Deploying often reduces the amount of time between the inception of an idea and the delivery of that idea’s value.
Lead Time (minutes)
lead time = average(time between merge to main branch and deployment to production)
Limiting our lead time affords us agility. This is most useful when things go wrong. Our average lead time will determine the floor for our ability to “roll forward” during an incident. This allows us to pivot when changes are necessary in production.
Change Failure Rate
change failure = number of incidents / number of deployments
Change failure is a measure of quality. It allows us to understand if we are delivering value in a high quality state. It is a counter balance to deployment frequency. Deploying often loses all value when our deployments cause issues for our users. Change failure lets us ensure our value delivery is not just frequent, but high quality.
Mean Time to Restore (minutes)
mttr = average(time to restore from outage or incident)
Mean Time to Restore (MTTR) is another anti fragility measure. Lead time is the floor at which we can roll forward during incidents, MTTR is closer to our actual performance (roll back, scale up, etc). Observing a significantly larger MTTR than Lead Time can indicate that we have issues in our people process, observability, or general agility in response to incidents. At Freckle we define an incident as a violation of specific SLOs (Service Level Objectives).
Uptime
uptime = 1 - (sum(outage minutes) / minutes in quarter)
We can’t deliver value if our services are not available. Uptime keeps us honest about how available we are to our users. We like to talk about nines in uptime (99.999%). How many nines do we have? We should strive for 4 nines of uptime. Hitting 5 nines of uptime can be an indication that we aren’t taking enough risks, aren’t utilizing our Error Budget, or we are over investing in availability at the cost to other investment opportunities.
Cost per Subscription
cost per subscription = infrastructure cost / active or enrolled students
We want to be judicious in our use of resources. Software businesses are only successful when they can exploit economies of scale. This allows us to indicate whether we are effectively investing in our infrastructure. Your org target will be defined by your market segment and will require research to determine.
Inspiration
We strive to align our metrics with industry standards and proven measures of excellence. We take inspiration from other organizations, community best practices, and well trodden paths.
DORA
The DevOps Research & Assessment report is a well respected industry standard. We take lots of inspiration from here and attempt to meet its definitions of elite execution.
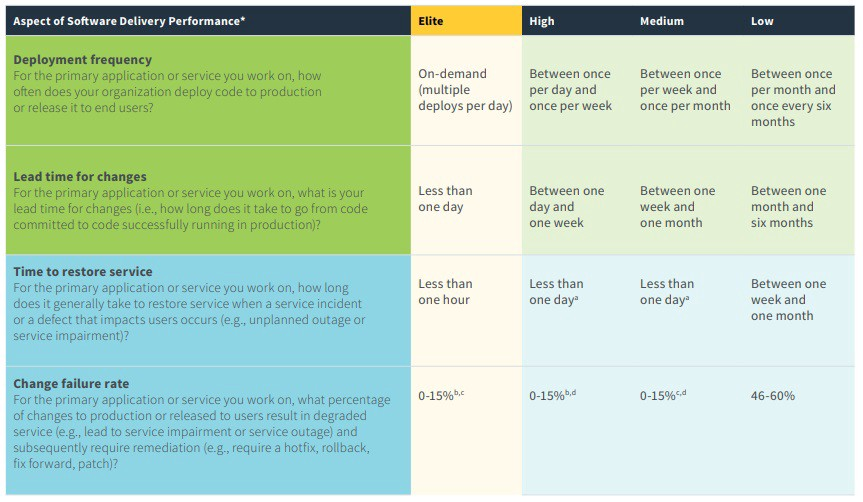
Freckle has achieved this level of elite execution for many years, but we are always looking for new ways to challenge ourselves, accelerate our delivery, and get a tighter user value life cycle.
In part 2, we discuss metrics we use to measure other flavors of excellence.